Thinking Outside the Box
This challenge is about showing your artistic side. Use data to create something artistic which fits into any of the 2020 GovHack Themes
Go to Challenge | 5 teams have entered this challenge.
Team Name:
Pandemic Perspective
Team Members:
Pandemic Perspective
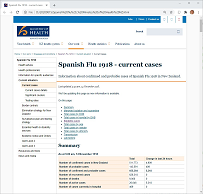
This project presents "historical fiction" versions of the 2020 NZ COVID-19 tracking dashboard. These show how that dashboard might have looked in 1918 during the Spanish Flu pandemic (102 years ago) and during an imagined outbreak in 2122 (102 years from now).
The story of the 1918 Spanish Flu pandemic is told in a narrative and quantitative manner by Dr Geoffrey Rice in his book Black November. In particular, Table 9.1 Geographical distribution of mortality lists deaths by ethnicity by region attributed to the pandemic. The report, Death by Numbers, provided a daily case incidence chart in Figure 3.1, but this was only for the Featherston Military Camp, so national statistics had to be extrapolated or estimated. (Again, this was a work of "fiction" -- BASED on available facts, but where no exact data was available the story was creatively embellished).
Description of Use Inspiration and support for the assertion that things are "Better, and bad, at the same time".
Description of Use Vaccine trend analysis used to extrapolate to future pandemics
Description of Use Provides daily incidence and mortality figures
Go to Challenge | 5 teams have entered this challenge.